The Weather in our Kingdom

June 17, 2017 9:50 pm

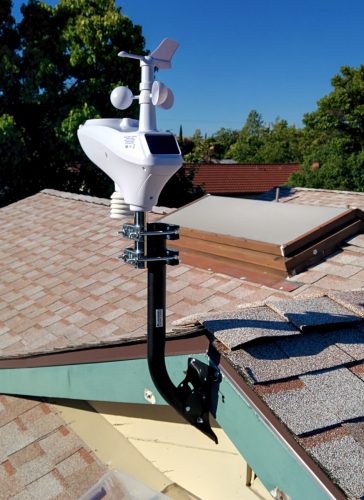
Jess got me a weather station for my birthday which is now installed up on the roof:

The unit is an Ambient Weather WS-1400-IP.  It reports temperature, humidity, wind speed, wind direction, rainfall, solar radiation, etc.  It comes with an indoor unit that also reports inside temperature and humidity.

The data is sent to wunderground.com and you can find it here: https://www.wunderground.com/personal-weather-station/dashboard?ID=KCALIVER107

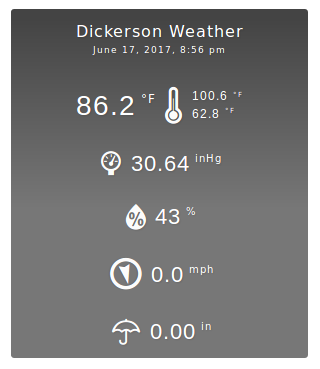
But, wunderground can be a little flaky, so I’m also capturing the data into my own database and serving it up.  On the sidebar of the blog you can find a widget that looks like this:

I’m using the “Weather Station” WordPress plugin to read a Cumulus-style file.  Now, the Ambient Weather ObserverIP unit does not produce the Cumulus “Realtime.txt” file that the WordPress plugin needs.  But, I have programming super powers.  So I wrote a shim that scrapes the data from the ObserverIP web interface and writes out a “Realtime.txt” file that I serve up for the WordPress plugin.

I also write out a human-readable page with the weather data on it you can see here: http://weather.serindu.com/

It’s not very pretty right now, but it’s up and running, updating every 5 minutes.  I’ll get around to improve the aesthetics at some point.

Having the indoor and outdoor sensors I’m thinking I’ll have to write up something that will notify me when the temperatures outside and inside cross so I’m alerted to open or close the windows as appropriate.  But I haven’t got that far yet.

The shim I wrote to put all these pieces together is available on GitHub: https://github.com/kdickerson/weather

It’s just a Python script set to run every 5 minutes via Cron.  It scrapes the data off the ObserverIP unit, formats it and inserts it into the SQLite database, computes daily high/low values from the stored data, and writes Realtime.txt and index.html into a folder being served by Apache.

Heather’s Dance Recital 2017

June 14, 2017 8:54 pm

Heather had an absolute blast in this year’s dance recital (as evidenced by the huge smile on her face through the entire dance).  Other than the rather stunning lack of theater etiquette displayed by a seemingly large chunk of the audience this year, it went great (seriously, who fully stands up from the front row during the middle of a performance to amble their way to the aisle and out of the theater!  Which meant my view was blocked completely during much of Heather’s big solo!  Grrr!).

The theater provided some pictures (both audience and from the stage) as well as video.  My pictures turned out much better this year than in the past.  Not sure what was different, but they’re definitely better.  Not amazing, but better.  The studio’s pictures were all slightly over-exposed, so I’m glad I took a bunch of my own.

Not much more to say, so I’ll let the pictures speak for themselves.  Video at the bottom!

Or download here: Heather Dance Recital – New York, NY – June 11, 2017 (40.4 MB)

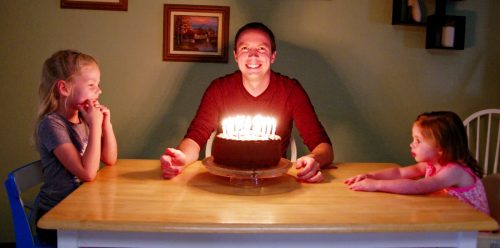
Kyle’s Birthday 2017

June 10, 2017 3:42 pm

Heather’s last day of school was Thursday, so I decided to take Friday off from work so we could go on an adventure for my birthday, which sounded much more fun than work.

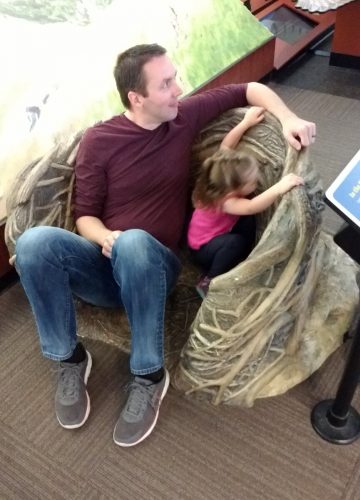
We went up to the Lindsay Wildlife Experience in Walnut Creek.  They have a wild animal hospital and outreach program and provide homes for animals that can’t be released back into the wild due to injury.  They have a roadrunner with bad eyesight, a peregrine falcon that can’t fly, and a barn owl with a bum wing (as well as many other critters, particularly raptors).  It’s a bit of an island-of-the-misfit-toys kind of place.

Unfortunately, after getting the camera all prepped and ready, I left it on the couch, so the only pictures we have are phone pictures, which aren’t nearly as nice.

Despite lack of quality pictures, the trip was great.  The birds were really cool to see so up close.  We watched a flight demonstration by the barn owl (with the bum wing).  We had lunch in the park.  We’ll have to go back again sometime.

Due to the timing of the trip and a very late lunch (and Heather and Corinne were exhausted from the excitement) we postponed birthday dinner until the next day.  So we went home and got some quick food into the girls and had cake and opened presents.  It was a good day.

How’s That Roof Working Out?

June 1, 2017 1:24 pm

Our house needed a new roof when we bought it.  There wasn’t anything particularly wrong with the roof, but it was 30 years old and worn out.  When we replaced the roof we went with light-colored shingles, added ridge venting, used radiant-barrier sheathing, and upgraded the attic insulation to a minimum of R38.

Well, now it’s been a few years and I have some data (thanks PG&E for making usage history available for download in CSV format) so it’s time to see how well all that stuff is working out for us.

Before we start, some caveats about the data.  I only have 1 year of data from before the roof replacement, so it’s not very stable data.  For the 3 years after, I’ve averaged each month to obtain more stable information.  The graphs start in December because the new roof was put on during October.  So December is the first full bill after the roof was completed.

The gas data is very consistent.  We have a gas dryer, gas water heater, and gas furnace.  Our laundry and hot-water usage is probably fairly consistent throughout the years (with a small increase in both when Corinne joined the family), so the change in therms seen from before to after should be pretty focused on heating.  We’ve heated the house to approximately the same temperature throughout each winter so it should be a very stable comparison.

The electrical usage, however, is much less stable.  Usage patterns have changed as Heather has grown, we’ve switched TVs, upgraded computers, more hard drives spinning, more often running dishwasher, etc.  So the comparisons for usage from before and after are much more muddied.

Let’s go to the data.

Gas
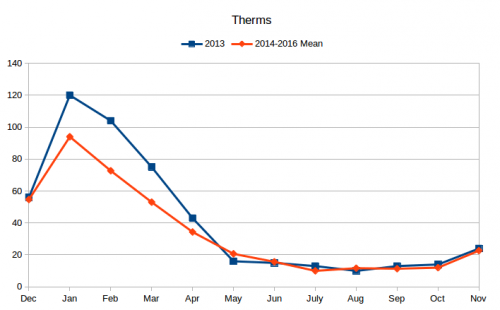
The gas usage shows an obvious reduction in gas usage throughout the winter months with equivalent usage during the summer.  This seems like pretty solid evidence that the upgraded insulation is making a difference.

The total therms used in 2013 was 503.  The average therms per year from 2014-2016 was 412.7.  An 18% reduction.  At an average of $1.29 per therm, this results in annual savings of $117.

Electricity
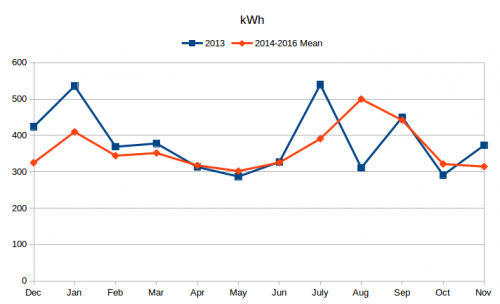
Sadly, the electrical usage doesn’t show an obvious dip during the summer months.  It actually shows a dip for the winter months which I presume must be related to the cost of running the blower on the furnace which didn’t need to run as much as evidenced by the reduced gas usage.

Regarding the summer months, the 2013 data is not very good to begin with.  This was our first year in the house and we were adjusting our usage.  The spike in July 2013 would have been our first hot month in the house (July bill, for June usage) and we ran the air conditioner liberally.  When we saw the power bill, we adjusted the air conditioning to reduce costs as seen in significant drop in usage in August.

The uptick in January is most likely due to Christmas lights.

Although there was not a clear drop in usage throughout the summer as I was hoping, there was an overall reduction. The total kilowatt-hours used in 2013 was 4599.  The average usage per year in 2014-2016 was 4344.3.  A reduction of 6%.  At an average of $0.17 per kWh this results in annual savings of $42.  However, due to the nature of the 2013 data the validity of this claim is suspect.

Due to the many confounding variables on the electrical usage (mentioned in the opening paragraphs), I don’t think this data can say that the high-reflectivity shingles, ridge venting, and radiant barrier were ineffective upgrades, but clearly they weren’t obvious wins either, about which I’m a bit disappointed.

If we assume the data is valid as presented then the net change is $159 per year in savings.  If we were to assume the entire benefit seen is due to the combined effect of the insulation and roof upgrades (and not changes in usage patterns), then the break even point of the upgrades would be ~38 years.  Which is longer than the expected life of the roof (30 years).  However, the insulation and radiant barrier are one-time expenses.  Unless the roof fails catastrophically neither one should need to be replaced when the next roof is installed.

The net effect is that my data doesn’t show the upgrades to have been a definitive win compared to a standard roof, however, I believe the electricity usage data is too inconsistent from year to year to be reliable to make any strong claim.  If I had a few more year’s worth of data from before the roof replacement I’d be able to make stronger claims about the effect.
Heard from the Girls

May 28, 2017 10:01 am

Heather, while camping: “Let’s have a conversation.  What’s your favorite food, drink, and, ummmmm, dinosaur? No wait, just dinosaur.”

Heather, while showering after camping:
“Ummm, Mom?  Dad?  Anybody out there except Corinne?!”
[Corinne’s interest is piqued and heads for the bathroom.]
“I need a washcloth!”
[Corinne wanders in, grabs a washcloth off the sink and tosses it into the tub.]
“Thanks Corinne.”
[Corinne wanders back to the TV Show she was watching.]

Corinne is confident in her identity if not her language skills:
“What’s your name?” — “I Kin!” [She’s missing ‘r’s]
“Are you a monkey?” — “No! I Kin!”
“Are you tired?” — “No! I Kin!”
“Are you my little girl?” — [Throws hands up in the air] “No! I big gul”
“You’re not a little baby?” — “No! I big!”
“You’re my big girl?” — “Uh huh”

These two are goofballs.