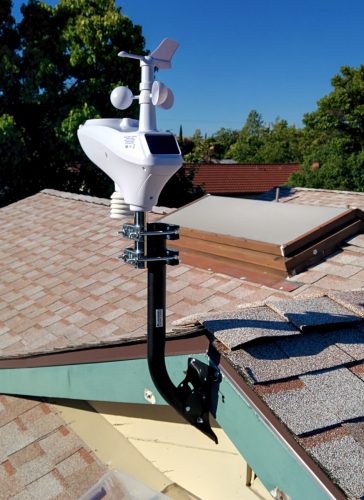
Our house needed a new roof when we bought it. There wasn’t anything particularly wrong with the roof, but it was 30 years old and worn out. When we replaced the roof we went with light-colored shingles, added ridge venting, used radiant-barrier sheathing, and upgraded the attic insulation to a minimum of R38.
Well, now it’s been a few years and I have some data (thanks PG&E for making usage history available for download in CSV format) so it’s time to see how well all that stuff is working out for us.
Before we start, some caveats about the data. I only have 1 year of data from before the roof replacement, so it’s not very stable data. For the 3 years after, I’ve averaged each month to obtain more stable information. The graphs start in December because the new roof was put on during October. So December is the first full bill after the roof was completed.
The gas data is very consistent. We have a gas dryer, gas water heater, and gas furnace. Our laundry and hot-water usage is probably fairly consistent throughout the years (with a small increase in both when Corinne joined the family), so the change in therms seen from before to after should be pretty focused on heating. We’ve heated the house to approximately the same temperature throughout each winter so it should be a very stable comparison.
The electrical usage, however, is much less stable. Usage patterns have changed as Heather has grown, we’ve switched TVs, upgraded computers, more hard drives spinning, more often running dishwasher, etc. So the comparisons for usage from before and after are much more muddied.
Let’s go to the data.
Gas
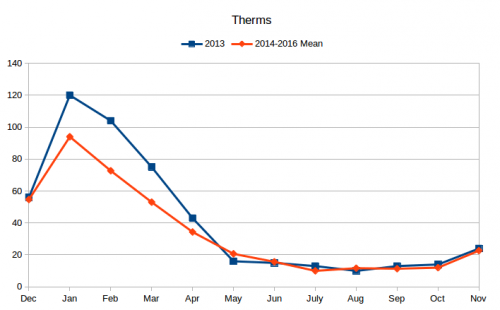
The gas usage shows an obvious reduction in gas usage throughout the winter months with equivalent usage during the summer. This seems like pretty solid evidence that the upgraded insulation is making a difference.
The total therms used in 2013 was 503. The average therms per year from 2014-2016 was 412.7. An 18% reduction. At an average of $1.29 per therm, this results in annual savings of $117.
Electricity
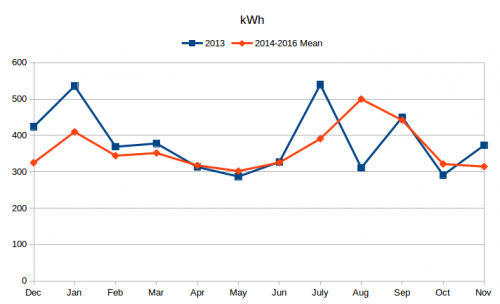
Sadly, the electrical usage doesn’t show an obvious dip during the summer months. It actually shows a dip for the winter months which I presume must be related to the cost of running the blower on the furnace which didn’t need to run as much as evidenced by the reduced gas usage.
Regarding the summer months, the 2013 data is not very good to begin with. This was our first year in the house and we were adjusting our usage. The spike in July 2013 would have been our first hot month in the house (July bill, for June usage) and we ran the air conditioner liberally. When we saw the power bill, we adjusted the air conditioning to reduce costs as seen in significant drop in usage in August.
The uptick in January is most likely due to Christmas lights.
Although there was not a clear drop in usage throughout the summer as I was hoping, there was an overall reduction. The total kilowatt-hours used in 2013 was 4599. The average usage per year in 2014-2016 was 4344.3. A reduction of 6%. At an average of $0.17 per kWh this results in annual savings of $42. However, due to the nature of the 2013 data the validity of this claim is suspect.
Due to the many confounding variables on the electrical usage (mentioned in the opening paragraphs), I don’t think this data can say that the high-reflectivity shingles, ridge venting, and radiant barrier were ineffective upgrades, but clearly they weren’t obvious wins either, about which I’m a bit disappointed.
If we assume the data is valid as presented then the net change is $159 per year in savings. If we were to assume the entire benefit seen is due to the combined effect of the insulation and roof upgrades (and not changes in usage patterns), then the break even point of the upgrades would be ~38 years. Which is longer than the expected life of the roof (30 years). However, the insulation and radiant barrier are one-time expenses. Unless the roof fails catastrophically neither one should need to be replaced when the next roof is installed.
The net effect is that my data doesn’t show the upgrades to have been a definitive win compared to a standard roof, however, I believe the electricity usage data is too inconsistent from year to year to be reliable to make any strong claim. If I had a few more year’s worth of data from before the roof replacement I’d be able to make stronger claims about the effect.